Learnings from the 2008 Great Recession

I didn’t want to write yet another article about the top 10 stocks you should own during a recession. There are so many articles on how people still need to eat, and you should pile money into “consumer defensive” stocks like Walmart that sell household staples. Yes you should do that. But there are other hidden gems that can help you stay safe during a recession, and capture opportunities for the eventual recovery. Here are the ones I found by analyzing every U.S. stock that traded during the recession.
- What stocks did I look at?
- You really are better off putting your cash in a savings account
- The market is often wrong about companies during a recession
- Not all best performers in a recession do well during recovery
- Need cash? Buy top dividend payers
- Pick a industry, not a stock
- For a housing crisis, REITs performed better than you’d think
- More companies that made most of their revenue in the U.S. outperformed the market
- Can’t repeat your success from the last time
- References and data sources
What stocks did I look at?
We’re talking about the Great Recession that wiped out a decade of growth, caused by the financial crisis of 2007–2008. I analyzed stock and company performance data spanning December 2007 to March 2009 1. I also analyzed the same companies’ performance during the 5-year period after the recession. Obviously this is assuming best and worst case scenarios. In real life, no one can accurately time the market, knowing exactly when the stock market will bottom, and the market can do so well for so long after a recession.
I analyzed 1,363 U.S. mid-cap and above stocks that traded during this time. I’m using S&P MidCap 400’s definition here: companies with market caps of $1.5 billion and above at the start of the recession. Unless I have a strong investment thesis, I avoid smaller companies during a recession. They have higher volatility and limited liquidity - both dangerous attributes when everyone else is selling and I’m trying to do the same.
You really are better off putting your cash in a savings account
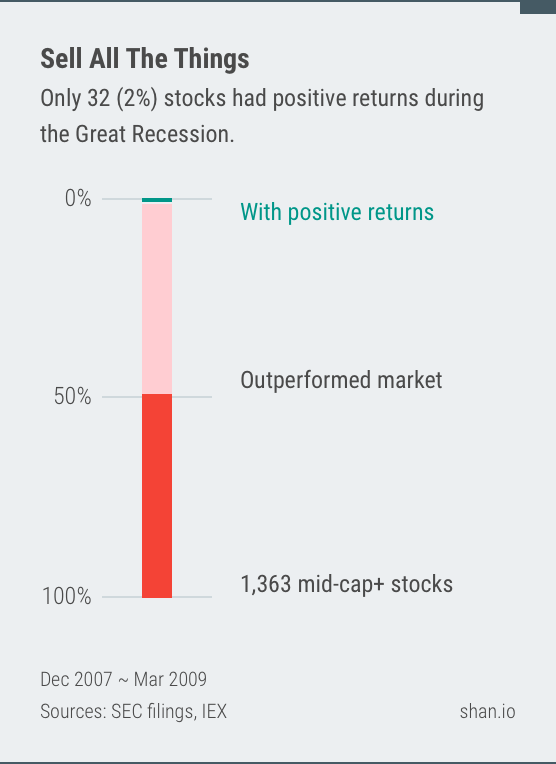
Before and during a recession, professional investors move their money out of stocks and into cash, even negative-yielding bonds that pay less than their cost. But why? During the recession, S&P 500 dropped -45% a year. That’s really not a bar you want to measure your investment to. Half of the companies outperformed the S&P 500 during the recession, but only 32 (2%) companies had a return above zero. You likely would’ve done a lot better if you also sold your stocks for cash, and cash gives you buying power to scoop up undervalued stocks too.

Only 32 (2%) stocks had positive returns during the Great Recession.
Here are all 32 companies that had positive total returns 2 during the recession:
| Symbol | Name | Sector | Total Returns |
|---|---|---|---|
| Bowles Fluidics Corporation | Manufacturing | 58% |
|
| MYGN | Myriad Genetics, Inc. | Manufacturing | 49% |
| NFLX | Netflix, Inc. | Information | 44% |
| ALST | AllStar Health Brands Inc | Manufacturing | 33% |
| DLTR | Dollar Tree, Inc. | Retail Trade | 28% |
| AZO | AutoZone, Inc. | Retail Trade | 22% |
| Odyssey Re Holdings Corp | Finance and Insurance | 17% |
|
| Family Dollar Stores, Inc. | Retail Trade | 16% |
|
| VRTX | Vertex Pharmaceuticals Incorporated | Manufacturing | 15% |
| CFFN | Capitol Federal Financial, Inc. | Finance and Insurance | 13% |
| FNF | Fidelity National Financial, Inc. - FNF Group | Finance and Insurance | 13% |
| SWN | Southwestern Energy Company | Mining, Quarrying, and Oil and Gas Extraction | 12% |
| ROST | Ross Stores, Inc. | Retail Trade | 11% |
| Terra Nitrogen Company, L.P. | Manufacturing | 11% |
|
| EW | Edwards Lifesciences Corporation | Manufacturing | 10% |
| Genentech Inc. | Manufacturing | 10% |
|
| Affiliated Computer Services Inc. Cl A | Information | 9% |
|
| ILMN | Illumina, Inc. | Manufacturing | 7% |
| Towers Watson & Co. Class A | Professional, Scientific, and Technical Services | 6% |
|
| AAP | Advance Auto Parts, Inc. | Retail Trade | 6% |
| PBCT | People’s United Financial, Inc. | Finance and Insurance | 6% |
| Sybase Inc | Information | 5% |
|
| CY | Cypress Semiconductor Corporation | Manufacturing | 4% |
| WMT | Walmart Inc. | Retail Trade | 4% |
| PetroHawk Energy Corp | Mining, Quarrying, and Oil and Gas Extraction | 4% |
|
| UMBF | UMB Financial Corporation | Finance and Insurance | 2% |
| Omnicare, Inc. | Retail Trade | 2% |
|
| ORLY | O’Reilly Automotive, Inc. | Retail Trade | 1% |
| Kinder Morgan Management, LLC | Transportation and Warehousing | 1% |
|
| NTES | NetEase, Inc. Sponsored ADR ADR China | Information | 1% |
| HRB | H&R Block, Inc. | Professional, Scientific, and Technical Services | .4% |
| ITT Educational Services, Inc. | Educational Services | .3% |
The market is often wrong about companies during a recession
A stock’s price is supposed to be based on the company’s future earnings, except when it isn’t. Investor confidence tanks during a recession, so they sell stocks, causing stock prices to drop, and this further weakens confidence. It’s a vicious cycle that’s often broken by governments stepping in.
When the market is wrong, it’s a great opportunity to pick up undervalued stocks. You also get a “margin of safety” - if you’re wrong, the low price you paid gives you a buffer to offset how wrong you were.
Margin of safety — never overpaying, no matter how exciting an investment seems to be — can you minimize your odds of being wrong.
― Benjamin Graham, The Intelligent Investor
Amazon is a great example: sales and earnings actually went up by double digits during the recession. This makes sense - back in 2007 Amazon had much lower prices than brick and mortar stores, and discount retailers do well during recessions. But its stock price was down by -26% anyway.
Another interesting sector to look at here is Finance and Insurance. These companies are closely related to what triggered the recession in the first place: the U.S. housing market. Yet the government didn’t allow the likes of AIG to die, and they thrived during the recovery. Just keep in mind that what caused the last recession probably won’t cause the next one.

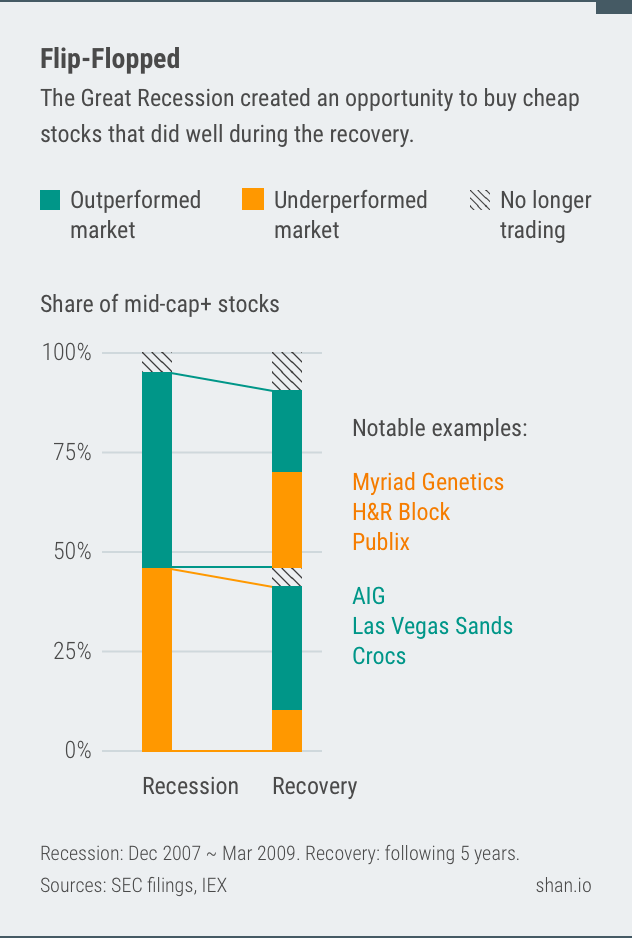
The Great Recession was a great time to buy underperformers that did well during the recovery.
Here are 20 extreme examples: the bottom 20 worst performers during the recession that outperformed the market during the recovery. Their recovery performance more than made up for their recession losses.
| Symbol | Name | Sector | Total Returns - Recession | Total Returns - Recovery |
|---|---|---|---|---|
| BRTX | BioRestorative Therapies, Inc. | Health Care and Social Assistance | -100% |
144% |
| AIG | American International Group, Inc. | Finance and Insurance | -98% |
61% |
| GGP, Inc. REIT | Finance and Insurance | -97% |
237% |
|
| LVS | Las Vegas Sands Corp. | Accommodation and Food Services | -96% |
192% |
| Sunrise Senior Living Inc. | Health Care and Social Assistance | -96% |
130% |
|
| CAR | Avis Budget Group, Inc. | Real Estate and Rental and Leasing | -95% |
219% |
| CROX | Crocs, Inc. | Manufacturing | -94% |
155% |
| PPC | Pilgrim’s Pride Corporation | Manufacturing | -94% |
94% |
| MIC | Macquarie Infrastructure Corporation | Finance and Insurance | -93% |
187% |
| CENX | Century Aluminum Company | Manufacturing | -93% |
66% |
| MGM | MGM Resorts International | Accommodation and Food Services | -92% |
58% |
| American Capital, Ltd. | Finance and Insurance | -92% |
107% |
|
| SIRI | Sirius XM Holdings, Inc. | Information | -92% |
140% |
| GNW | Genworth Financial, Inc. Class A | Finance and Insurance | -91% |
96% |
| C | Citigroup Inc. | Finance and Insurance | -91% |
32% |
| National Financial Partners Corp. | Finance and Insurance | -90% |
82% |
|
| STAR | iStar Inc. REIT | Finance and Insurance | -90% |
72% |
| Hercules Offshore Inc | Mining, Quarrying, and Oil and Gas Extraction | -90% |
53% |
|
| XL Group Ltd Bermuda | Finance and Insurance | -89% |
90% |
|
| ODP | Office Depot, Inc. | Retail Trade | -89% |
47% |
Not all best performers in a recession do well during recovery
Be careful with these. They may look OK during the recession, just know that you can’t time the end of the recession. For example, H&R Block often appears on the recession best-of list. Nothing can be said to be certain, except death and taxes, right? Not when the software is eating your world and you’re down when the market is up 25% a year.
There are 53 (4%) companies that had above market returns during the recession, but negative returns during the recovery. Here are the top 20:
| Symbol | Name | Sector | Total Returns - Recession | Total Returns - Recovery |
|---|---|---|---|---|
| MYGN | Myriad Genetics, Inc. | Manufacturing | 49% |
-13% |
| ALST | AllStar Health Brands Inc | Manufacturing | 33% |
-73% |
| CFFN | Capitol Federal Financial, Inc. | Finance and Insurance | 13% |
-4% |
| PBCT | People’s United Financial, Inc. | Finance and Insurance | 6% |
-6% |
| HRB | H&R Block, Inc. | Professional, Scientific, and Technical Services | .4% |
-1% |
| ITT Educational Services, Inc. | Educational Services | .3% |
-15% |
|
| Foy-johnston, Inc. | Mining, Quarrying, and Oil and Gas Extraction | .0% |
-97% |
|
| Winter Sports Inc. | Arts, Entertainment, and Recreation | .0% |
-16% |
|
| AFIPA | AMFI Corporation Class A | Finance and Insurance | -1% |
-7% |
| TFSL | TFS Financial Corporation | Finance and Insurance | -3% |
-6% |
| STRA | Strategic Education, Inc. | Educational Services | -3% |
-13% |
| PUSH | PUBLIX SUPER MARKETS, INC. | Retail Trade | -3% |
-46% |
| Delaware Bancshares, Inc. | Management of Companies and Enterprises | -4% |
-11% |
|
| Apollo Education Group, Inc. Class A | Educational Services | -4% |
-16% |
|
| LDOS | Leidos Holdings, Inc. | Professional, Scientific, and Technical Services | -4% |
-14% |
| ATGE | Adtalem Global Education Inc. | Educational Services | -4% |
-11% |
| ACM | AECOM | Professional, Scientific, and Technical Services | -6% |
-1% |
| GHL | Greenhill & Co., Inc. | Finance and Insurance | -7% |
-9% |
| PHM | PulteGroup, Inc. | Construction | -7% |
-2% |
| SKTP | Skytop Lodge Corporation | Accommodation and Food Services | -8% |
-15% |
Need cash? Buy top dividend payers
802 (59%) of companies paid dividends during the recession. Most companies don’t pay more than bonds or CDs do 3. If your goal is to live off of just dividends, say if you lose your job during a recession, you must hold a lot of shares in a lot of stocks that pay dividends.
But dividends rarely make a bad buy good. If your goal is growth, focus on how the company will grow. Companies use dividends to reassure you that the profits you’re seeing today are here to stay. Or that they just ran out of ideas of what to do with their cash piles - Apple did when its cash hit $100 billion in 2012.
Here’s a list of the top 20 dividend payers that had above market returns during the recession. There are a lot of traditional industries that are great at generating cash, but they’re not exactly hotbeds of innovation.
| Symbol | Name | Sector | Price Returns | Dividend Yield | Total Returns |
|---|---|---|---|---|---|
| PDLI | PDL BioPharma, Inc. | Professional, Scientific, and Technical Services | -46% |
69% |
-28% |
| CQP | Cheniere Energy Partners, L.P. | Mining, Quarrying, and Oil and Gas Extraction | -51% |
46% |
-40% |
| FRO | Frontline Ltd. Bermuda | Transportation and Warehousing | -48% |
28% |
-41% |
| Terra Nitrogen Company, L.P. | Manufacturing | -2% |
16% |
11% |
|
| BPT | BP Prudhoe Bay Royalty Trust | Manufacturing | -15% |
16% |
-4% |
| BHC | Bausch Health Companies Inc. Canada | Manufacturing | -26% |
16% |
-17% |
| Enbridge Energy Partners, L.P. Class A | Transportation and Warehousing | -38% |
15% |
-31% |
|
| Teppco Partners L P Ut Ltd Partner | Transportation and Warehousing | -36% |
15% |
-30% |
|
| NLY | Annaly Capital Management, Inc. REIT | Finance and Insurance | -16% |
13% |
-5% |
| ET | Energy Transfer, L.P. | Transportation and Warehousing | -36% |
12% |
-31% |
| Regal Entertainment Group Class A | Information | -41% |
12% |
-36% |
|
| NRP | Natural Resource Partners L.P. | Mining, Quarrying, and Oil and Gas Extraction | -30% |
12% |
-25% |
| FTR | Frontier Communications Corporation Class B | Information | -38% |
11% |
-32% |
| CEQP | Crestwood Equity Partners LP | Transportation and Warehousing | -25% |
11% |
-17% |
| MO | Altria Group Inc | Manufacturing | -30% |
11% |
-26% |
| Energy Transfer Partners, L.P. | Transportation and Warehousing | -25% |
11% |
-18% |
|
| Windstream Holdings, Inc. | Information | -36% |
11% |
-30% |
|
| BPL | Buckeye Partners, L.P. | Transportation and Warehousing | -15% |
11% |
-8% |
| Boardwalk Pipeline Partners, LP | Transportation and Warehousing | -28% |
11% |
-23% |
|
| DO | Diamond Offshore Drilling, Inc. | Mining, Quarrying, and Oil and Gas Extraction | -39% |
10% |
-35% |
Pick a industry, not a stock
Picking a recession-proof stock isn’t sufficient, because not everyone in a recession-proof industry do well. For example, the Pharmaceutical and Medicine Manufacturing industry did well during the last recession, and includes some of the top performers. But Merck, one of the biggest names in the business, returned -49% annually, below the already abysmal S&P 500 benchmark.
Here are the top and bottom performing Pharmaceutical and Medicine Manufacturing companies:
| Symbol | Name | Total Returns |
|---|---|---|
| MYGN | Myriad Genetics, Inc. | 49% |
| ALST | AllStar Health Brands Inc | 33% |
| VRTX | Vertex Pharmaceuticals Incorporated | 15% |
| Genentech Inc. | 10% |
|
| Abraxis BioScience (New) | -1% |
|
| MRK | Merck & Co., Inc. | -49% |
| Medicis Pharmaceutical Corp. | -50% |
|
| Alere Inc. | -54% |
|
| Amylin Pharmaceuticals Inc. | -68% |
|
| Wuxi PharmaTech (Cayman) Inc. Sponsored ADR ADR China | -77% |
|
| Immunosyn Corporation | -95% |
For a housing crisis, REITs performed better than you’d think
There were 71 (5%) publicly traded Real Estate Investment Trusts (REITs) during the last recession. No REIT had a positive return, but 27 (38%) out of all REITS performed above market.
This is a classic case of not every recession being created equal. If the next recession is caused by something not related to real estate, say U.S.-China trade, give REITs a look as a place to park your money. The high dividends this asset class pays can help you get through a cash crunch.
Here are the top 20 performing REITs:
| Symbol | Name | Sector | Price Returns | Dividend Yield | Total Returns |
|---|---|---|---|---|---|
| NLY | Annaly Capital Management, Inc. | Finance and Insurance | -16% |
13% |
-5% |
| DLR | Digital Realty Trust, Inc. | Finance and Insurance | -18% |
4% |
-15% |
| PSA | Public Storage | Finance and Insurance | -23% |
3% |
-21% |
| WELL | Welltower, Inc. | Finance and Insurance | -26% |
6% |
-21% |
| OFC | Corporate Office Properties Trust | Finance and Insurance | -26% |
5% |
-22% |
| PDM | Piedmont Office Realty Trust, Inc. Class A | Finance and Insurance | -26% |
2% |
-24% |
| Nationwide Health Properties Inc. | Real Estate and Rental and Leasing | -29% |
6% |
-25% |
|
| O | Realty Income Corporation | Finance and Insurance | -32% |
7% |
-27% |
| LPT | Liberty Property Trust | Finance and Insurance | -35% |
10% |
-30% |
| JOE | St. Joe Company | Construction | -30% |
.0% |
-30% |
| NNN | National Retail Properties, Inc. | Finance and Insurance | -35% |
9% |
-30% |
| HIW | Highwoods Properties, Inc. | Finance and Insurance | -34% |
6% |
-30% |
| AMT | American Tower Corporation | Finance and Insurance | -30% |
.0% |
-30% |
| PCH | PotlatchDeltic Corporation | Finance and Insurance | -34% |
8% |
-30% |
| Home Properties, Inc. | Real Estate and Rental and Leasing | -35% |
7% |
-30% |
|
| SNH | Senior Housing Properties Trust | Finance and Insurance | -36% |
8% |
-31% |
| RYN | Rayonier Inc. | Finance and Insurance | -36% |
6% |
-33% |
| Plum Creek Timber Company, Inc. | Agriculture, Forestry, Fishing and Hunting | -37% |
5% |
-34% |
|
| HCP | HCP, Inc. | Finance and Insurance | -39% |
7% |
-34% |
| SBAC | SBA Communications Corp. Class A | Finance and Insurance | -38% |
.0% |
-38% |
More companies that made most of their revenue in the U.S. outperformed the market
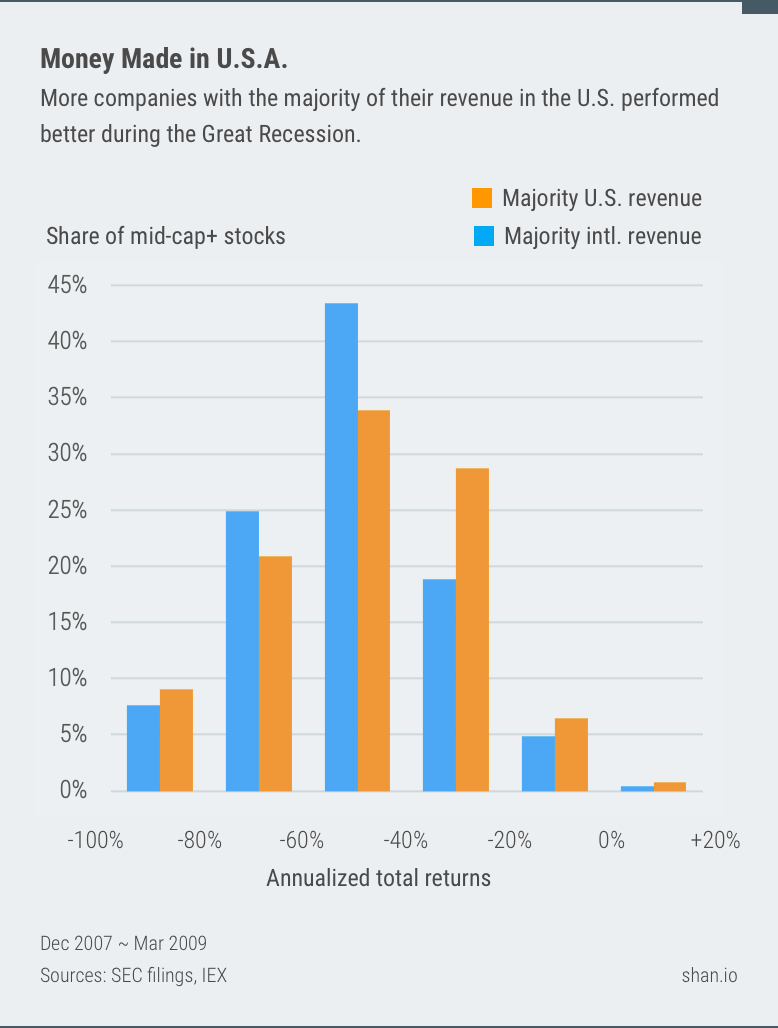
Since the Great Recession was caused by the U.S., I thought the 77% of the companies that made most of their revenue in the U.S. would’ve done worse. I was wrong. Slightly more of them outperformed the market than the companies with more international revenue.

More companies with the majority of their revenue in the U.S. performed better during the Great Recession.
There are some surprising names in the list of companies with more international revenue, including classic all-American brands like McDonald’s and IBM. For a closer look, here are the top 20 performers with more international revenue:
| Symbol | Name | Sector | Total Returns | U.S. Revenue |
|---|---|---|---|---|
| Odyssey Re Holdings Corp | Finance and Insurance | 17% |
20% |
|
| EW | Edwards Lifesciences Corporation | Manufacturing | 10% |
45% |
| ILMN | Illumina, Inc. | Manufacturing | 7% |
49% |
| Towers Watson & Co. Class A | Professional, Scientific, and Technical Services | 6% |
43% |
|
| Sybase Inc | Information | 5% |
47% |
|
| CY | Cypress Semiconductor Corporation | Manufacturing | 4% |
21% |
| Rohm & Haas Co. | Manufacturing | -1% |
41% |
|
| ALXN | Alexion Pharmaceuticals, Inc. | Professional, Scientific, and Technical Services | -5% |
44% |
| MCD | McDonald’s Corporation | Accommodation and Food Services | -6% |
34% |
| ACM | AECOM | Professional, Scientific, and Technical Services | -6% |
46% |
| ATVI | Activision Blizzard, Inc. | Information | -8% |
49% |
| IBM | International Business Machines Corporation | Professional, Scientific, and Technical Services | -9% |
35% |
| BAX | Baxter International Inc. | Manufacturing | -11% |
41% |
| Wyeth | Manufacturing | -11% |
47% |
|
| ABT | Abbott Laboratories | Manufacturing | -12% |
49% |
| NEM | Newmont Goldcorp Corporation | Mining, Quarrying, and Oil and Gas Extraction | -12% |
31% |
| QCOM | QUALCOMM Incorporated | Manufacturing | -13% |
9% |
| XLNX | Xilinx, Inc. | Manufacturing | -14% |
32% |
| Altera Corporation | Manufacturing | -14% |
21% |
|
| CCK | Crown Holdings, Inc. | Manufacturing | -15% |
26% |
Can’t repeat your success from the last time
496 (36%) stocks are no longer around, including 1/3 of the ones that had a positive return. They were either acquired, went bankrupt, or simply decided that it’s not worth being a public traded company anymore 4.
If your strategy is to buy and hold, stick to mid cap or larger stocks, or buy funds that re-balance for you (in exchange for a small fee). The higher volatility and churn that come with smaller companies requires your higher attention to maximize returns - something you may not want to spend time on.
Your turn: find hidden gems in the complete raw data
Here’s the complete list of stocks that traded during the 2008 Great Recession, their performance during the recession and the post-recession recovery. I’d love to hear what other insights you find in the raw data.
References and data sources
My data sources include SEC filings and tier 1 data vendors used by everyone on Wall Street, via IEX, the Investors Exchange.
Thanks to Snigdha Kumar for her feedback.
Scary disclosure: I write about things I may invest in. You should also do your own research before investing.
-
For the start of the recession, I use the National Bureau of Economic Research (NBER)’s definition. The stock market bottomed in March 2009, so that’s what I used instead of NBER’s end date of June 2009. ↩
-
Total return is the annualized compound total return, with auto-reinvested dividends, and without fees. This is similar to how DRIP (Dividend Reinvestment Plan) works. ↩
-
Dividends look a lot better when they become “qualified” and you pay the much lower capital gains tax rate instead of the income tax rate. To become “qualified”, you just have to hold the stock for a while. More here. ↩
-
There are half as many public companies as 20 years earlier. You and I simply can’t fund our retirements with stocks as we used to. It’s a problem my team is aiming to solve at The Long-Term Stock Exchange. ↩
I'd love to hear what you think about this essay. Your feedback makes my work better. You can chat with me on Twitter and Hacker News .